The ondemand governor adjust the processor frequency making a trade-off between power and performance, and is the implementation of Dynamic Frequency Scaling under Linux. However, it was also causing unexpected delays in my performance benchmarks. The following figure shows the delay density of RPC requests for the CPU frequency governor ondemand and performance. Delay variation is lower when the CPU frequency is fixed.
I wanted to visualize how the frequency changes according to time and scheduling. I used LTTng to record power_cpu_frequency and sched_switch events. I loaded them in Trace Compass, and defined the analysis declaratively using XML (available here). The CPU frequency is shown in shades of red (stronger means higher frequency) and in green whether the CPU is busy or idle. (you guessed correctly, holiday season is coming). We see in the following figure that it takes some time for the frequency to ramp-up.
In fact, changing the CPU frequency is equivalent to distorts the elapsed time of the execution. Timestamps in the trace are in nanoseconds instead of clock cycles, but to compare executions, the base should be clock cycles instead. We could scale the time using the frequency events to approximate the time in processor cycles.
The task kworker, woken-up from a timer softirq, changes the CPU frequency. The kworker thread runs with a varying period, typically between 4ms and 20ms. The algorithm seems to take into account the average CPU usage, because if the CPU does rapid context switch between idle and busy, the frequency never reaches the maximum.
Therefore, a task performing frequent blocking/running cycles may run faster if it shares the CPU with another task, because the average CPU usage will increase and frequency will be set accordingly. We could also estimate the relative power cost of a segment of computation with great precision.
In conclusion, disabling frequency scaling for benchmarks should reduce variability. Here is how to do it on recent Linux kernels:
set_scaling_gov() {
gov=${1-performance}
for i in $(ls -1 /sys/devices/system/cpu/cpu*/cpufreq/scaling_governor); do
echo ${gov} | sudo tee $i > /dev/null
done
}
Here is the view for the whole trace. Happy hacking!
mercredi 19 novembre 2014
dimanche 19 octobre 2014
LinuxCon 2014, Düsseldorf
Distributed Active Path from Kernel Trace
I presented recent work about the recovery of active path of a distributed program, only using a kernel trace. The result is a time-view of the execution across computers. One of the most interesting result is the Django Poll three-tiers app, including an Apache web server and a PostgreSQL database. Client is simulated by scripting with Mechanize. The screen shot shows the execution for the POST, where a large sync is visible near the end of the sequence, necessary for the update SQL statement.Declarative views from user-space trace with Trace Compas
Geneviève Bastien presented how to use LTTng-UST and Trace Compas to create a time view of the state of an MPI computation. The MPI program simulates unbalanced computation, where the green represent work, and red is wait at the barrier. Multiple cycles are shown, and all the views are synchronized, which is handy to analyse the application at multiple level at once. In the following figure, we see below that the wait at the barrier (in red) is actually implemented using a busy loop calling non-blocking poll() system call, shown on top. We observed this behavior with the OpenMPI library, and we think it is intended to reduce the latency at the expense of power and resource efficiency.![]() |
| Below: MPI imbalance application state (green: compute, red: wait). Above: corresponding kernel trace, including a zoom on the busy wait. |
Preemption analysis across host and virtual machines
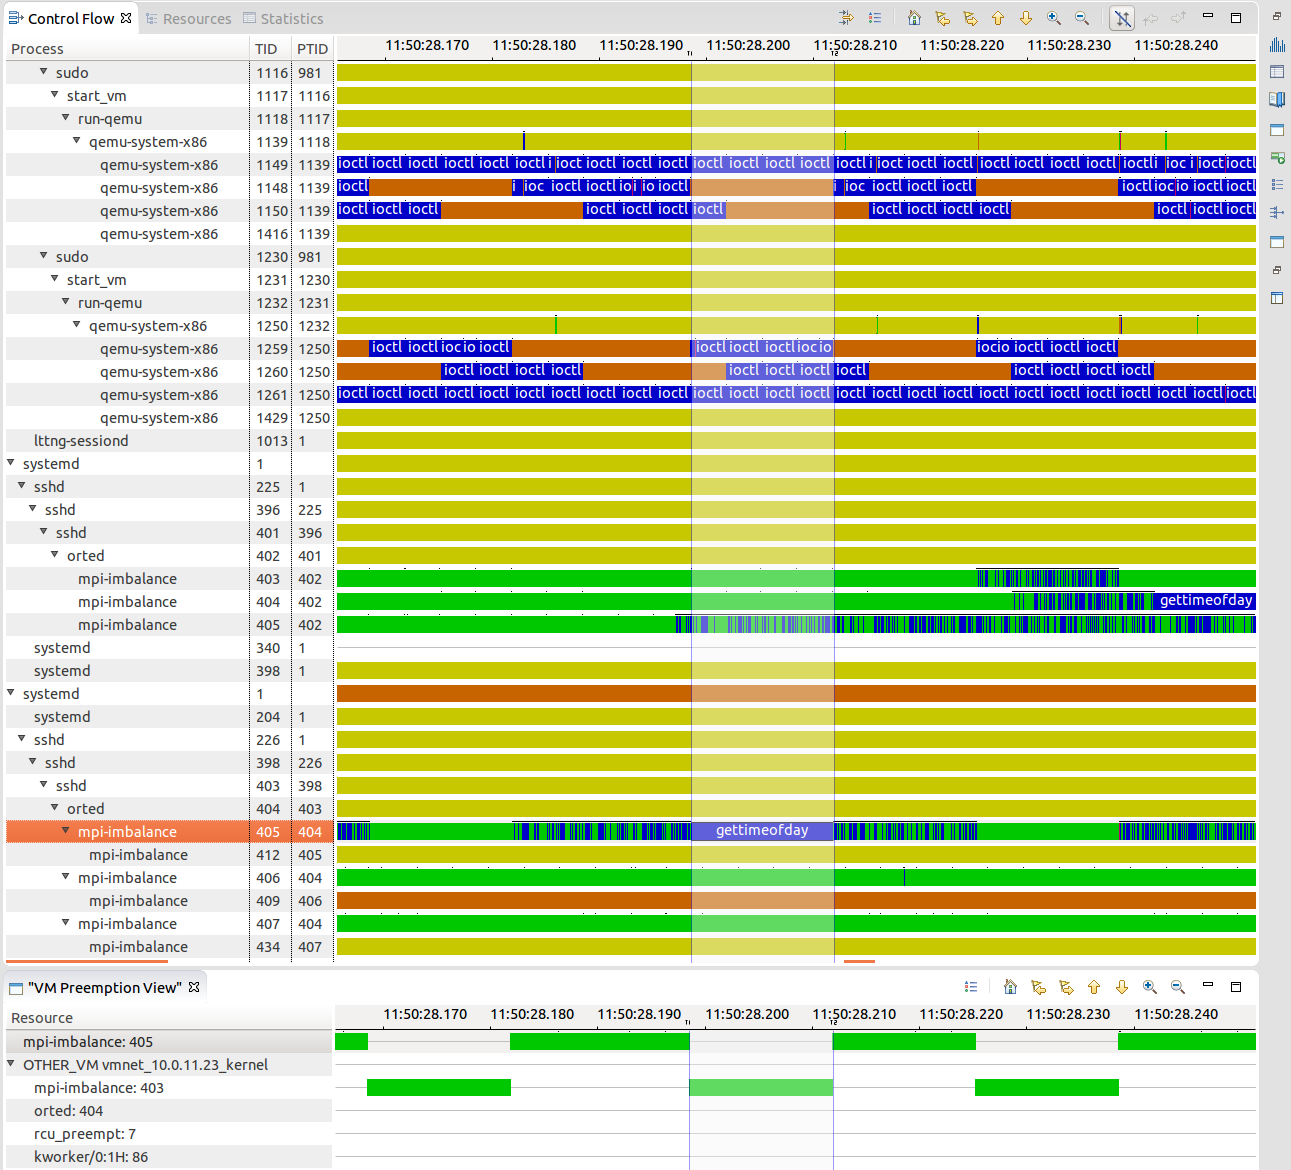
Execution in virtual machines is subject to higher level of variation in response time. Geneviève Bastien presented the virtual machine analysis, that shows the preemption crossing virtual machines boundaries, the research result of former student Mohamad Gebai. A process in the VM may appear to run while it is not, because the process representing its virtual CPU on the host is be preempted. The host and the VMs are traced at the same time, and traces are synchronized. The global view of the resources allows to pinpoint preemption cause given a task, whenever the other task is local, on the host or inside another virtual machine. The following figure shows qemu processes on the host and traces from within the host. We clearly see a gettimeofday() that is much longer that one would expect (13ms instead of ~200ns), and the reason is that there is another process, in another VM, that was running for that time, and the preemption cause is shown below.
![]() |
| Total view of the system, crossing virtual machine boundaries. |
ftrace
Sten Rosted from RedHat presented the inner working of ftrace. It is a framework to hook into each function in the kernel. The kernel is compiled with gcc -pg option, that adds a call to mcount() at the beginning of each function, but this call is replaced by nops. The space left in each function header is patched at runtime to jump to the instrumentation. This framework is used by kprobe, but the ftrace backend can be used directly instead.
folly
Ben Maurer from Facebook presented efficiency and scalability issues they face in their environment. Performance in accepting connections is critical. He mentioned that getting the next available file descriptor is a linear search that hurts the performance. He also shows a method to decrease the number of scheduling switch of workers by replacing pthread condition wait, and improving load distribution among threads. I liked his quantitative approach, always evaluating both kernel and user-space solutions to the same problem.
Cycle accurate profiling using CoreSight hardware trace
Pawel Moll from ARM presented the CoreSight instruction tracing capabilities. The processor records branch taken and the number of cycles taken by each instructions. He demonstrated a prototype of cycle accurate (i.e. exact cycle count) profiler. The trace decoding is somewhat cumbersome, because the code memory must be reconstructed offline to resolve address symbols, and the complete toolchain requires proper integration, but still an impressive demonstration.
Thanks to NVIDIA!
I also got a JETSON TK1 big.LITTLE board from NVIDIA. I will be able to test heterogenous traces experiments (x86, arm), a very common case for mobile and cloud computing. I will also be able to test the CoreSight tracing. Thanks NVIDIA!
Libellés :
kernel,
kvm,
linux,
linuxcon,
lttng,
performance analysis,
trace compas,
tracing,
tracing summit,
user-space,
virtual machine
mercredi 8 octobre 2014
Ubuntu login analysis
I'm tracing a lot these days, and in the viewer, I need to scroll a lot to get to the interesting stuff in the control flow view. Today, I checked all these processes for fun. In fact, it's related to landscape triggered on Ubuntu login. To display the message about system usage and updates (which I think is great), landcape calls numerous sub-programs, for a total of about 250ms on my system. It's something one should keep in mind if SSH commands are repeated in a tight loop: the maximum rate is about 4 commands per seconds. Hopefully, Fabric reuses SSH connection! ;-)
![]() |
| Ubuntu login greeting |
![]() |
| The active path of the computation of the login greeting |
mercredi 6 août 2014
Pinpoint memory usage of Java program with Eclipse Memory Analyzer
My Java program was using a lot of memory. An object was holding a reference on a large temporary data structure, even after it was out of scope. It is indeed difficult to understand what prevent the garbage collection to do its job. Here is how I found out.
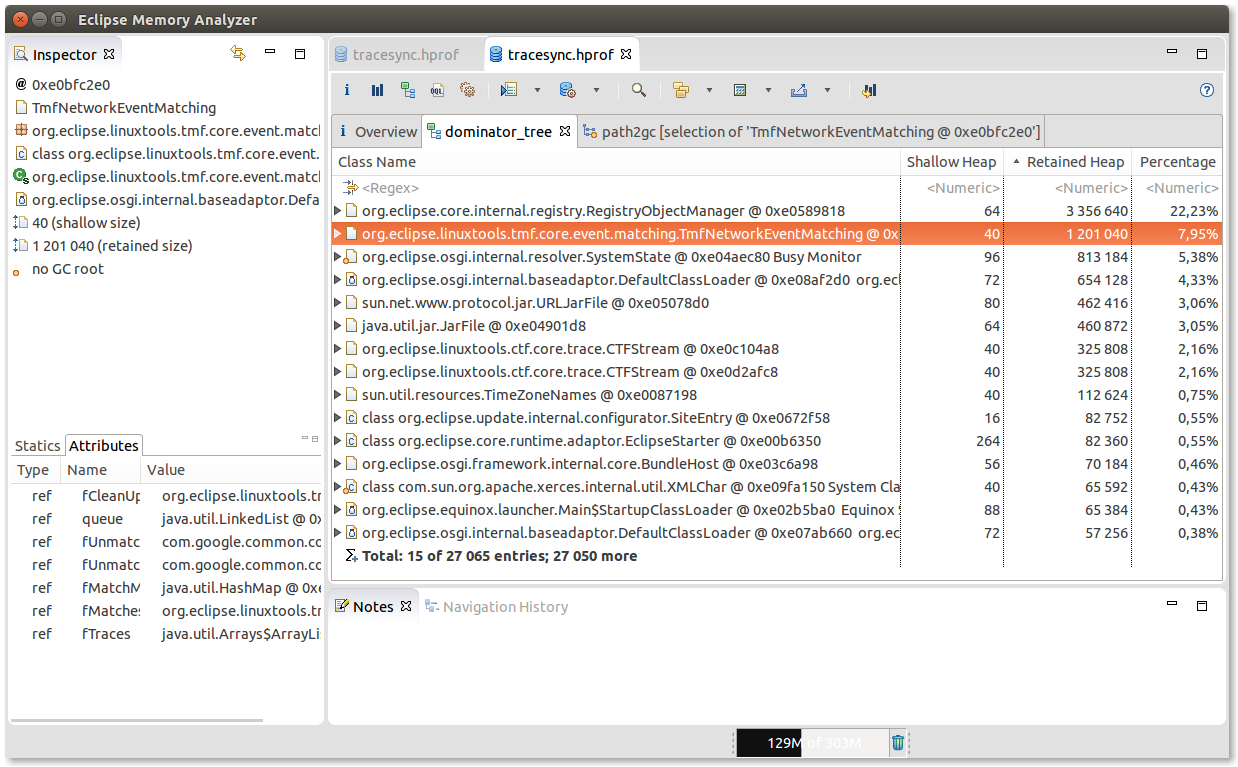
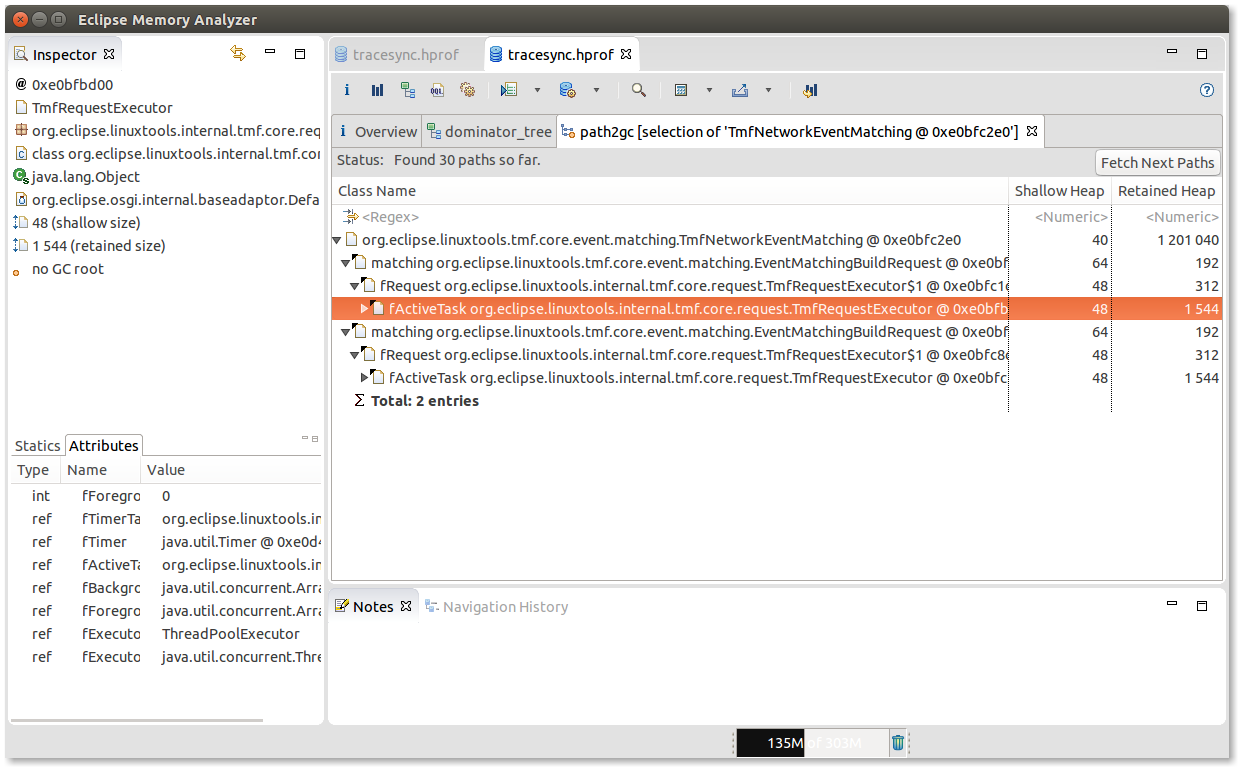
The following screenshots shows an example of the tool usage for my problem. The class TmfNetworkEventsMatching matches send to receive network events in a trace. Unmatched packets are kept temporarily in memory. However, the old unmatched packets were never freed. In the Dominator Tree, we see that TmfNetworkEventsMatching is 40 bytes (Shallow Heap), but holds around 1.2MB of objects (Retained Heap). The Path to GC Roots highlights that a reference of TmfNetworkEventMatching is kept inside TmfRequestExecutor. In this case, a missing call to dispose() was preventing the release of resources. Other resources are auto-closable, except for one of them, which needs manual call to dispose(). Thank you MAT!
- Download and extract Eclipse Memory Analyzer (MAT).
- Download the HeapDump.java class and insert a call to HeapDump.dumpHeap() after the point your think the memory should be released.
- Run the instrumented program. The resulting file size may be rather large (seems to be the hole VM memory), so make sure you have enough free space.
- Open it in MAT. (Notice: I was experiencing a hang bug on Ubuntu 14.04, dismiss the initial report dialog and do not generate HTML reports, it seems to trigger the bug). Click on Dominator Tree.
- Once you found the offending object, right click on it and select Path to GC Roots > with all references. This will display the references that prevent the GC to free this object.
- Fix the code and you can start over to verify that the problem is indeed fixed ;-)
The following screenshots shows an example of the tool usage for my problem. The class TmfNetworkEventsMatching matches send to receive network events in a trace. Unmatched packets are kept temporarily in memory. However, the old unmatched packets were never freed. In the Dominator Tree, we see that TmfNetworkEventsMatching is 40 bytes (Shallow Heap), but holds around 1.2MB of objects (Retained Heap). The Path to GC Roots highlights that a reference of TmfNetworkEventMatching is kept inside TmfRequestExecutor. In this case, a missing call to dispose() was preventing the release of resources. Other resources are auto-closable, except for one of them, which needs manual call to dispose(). Thank you MAT!
![]() |
| Dominator Tree |
![]() |
| Path to GC Roots |
jeudi 29 mai 2014
Performance comparison of CTF trace readers
I'm implementing a kernel trace analysis using the Java CTF reader, and I wanted to know if I would increase the performance by going with the babeltrace reader in C. Here are my findings.
One of the expansive step of trace analysis is the actual trace reading. It consists to read the binary trace and retrieve the timestamps, the event type and the value of each fields. The event is then added to a priority queue for reading multiple streams in order. We compare three trace readers, namely the Babeltrace reader 1.2 (C implementation, dummy output format), the Java CTF reader and the Eclipse TMFEventRequest (which uses the Java CTF reader as back-end). We compare the trace reading in cache cold conditions (drop_caches prior to reading) to when the trace is resident in page cache. I ensure that the lazy loading of fields values are effectively loaded in all cases, but without printing the content. The trace size is 855MB and contains 22 million kernel events from a Django web app benchmark (recorded with lttng), and it takes between 20s and 80s to process the trace. The drive used is an SSD Crucial M500 1TB, and the host is an i7-4770 with 32GB of RAM. The following figure shows the performance results in thousands of events per second.
We observe that babeltrace is roughly 2 times faster than the CTFTraceReader in Java, and about 3.5 times faster than TmfEventRequest. I measured also the CPU usage, and the processing is mostly serial and single threaded in every cases, so babeltrace seems effectively more efficient.
The other important observation is that trace parsing is CPU bound, not I/O bound. Reading a trace from a hard drive is certainly I/O bound, but it's not the case with SSD. The difference between cache cold and cache hot is between 2% and 5% either in Java or in C. It means we could probably speed-up the reading using parallel threads.
In conclusion, both the C and the Java libraries provides acceptable performance level for CTF trace reading. For high-performance processing, the babeltrace library is preferable. The CTFTraceReader provides nonetheless a good performance, and may be a compromise between the rapid development and runtime efficiency. If abstracting the trace source is a requirement, then TMF is what you need, but you now know the cost of this additional flexibility. Yours to choose!
Notice: the TMFEventRequest can be done either with ExecutionType.FOREGROUND or ExecutionType.BACKGROUND. The background parameter introduce delays (sleeps) and reduces the throughput. Use the foreground parameter to reduce processing time and improve UI interactivity, but uses background for low priority processing.
One of the expansive step of trace analysis is the actual trace reading. It consists to read the binary trace and retrieve the timestamps, the event type and the value of each fields. The event is then added to a priority queue for reading multiple streams in order. We compare three trace readers, namely the Babeltrace reader 1.2 (C implementation, dummy output format), the Java CTF reader and the Eclipse TMFEventRequest (which uses the Java CTF reader as back-end). We compare the trace reading in cache cold conditions (drop_caches prior to reading) to when the trace is resident in page cache. I ensure that the lazy loading of fields values are effectively loaded in all cases, but without printing the content. The trace size is 855MB and contains 22 million kernel events from a Django web app benchmark (recorded with lttng), and it takes between 20s and 80s to process the trace. The drive used is an SSD Crucial M500 1TB, and the host is an i7-4770 with 32GB of RAM. The following figure shows the performance results in thousands of events per second.
The other important observation is that trace parsing is CPU bound, not I/O bound. Reading a trace from a hard drive is certainly I/O bound, but it's not the case with SSD. The difference between cache cold and cache hot is between 2% and 5% either in Java or in C. It means we could probably speed-up the reading using parallel threads.
In conclusion, both the C and the Java libraries provides acceptable performance level for CTF trace reading. For high-performance processing, the babeltrace library is preferable. The CTFTraceReader provides nonetheless a good performance, and may be a compromise between the rapid development and runtime efficiency. If abstracting the trace source is a requirement, then TMF is what you need, but you now know the cost of this additional flexibility. Yours to choose!
Notice: the TMFEventRequest can be done either with ExecutionType.FOREGROUND or ExecutionType.BACKGROUND. The background parameter introduce delays (sleeps) and reduces the throughput. Use the foreground parameter to reduce processing time and improve UI interactivity, but uses background for low priority processing.
jeudi 5 décembre 2013
System-level profiling of APT
APT is the package manager of Debian based distributions. Understanding where the time is spent installing a package is difficult, because there are numerous process involved. We discuss limitations of profiler tools and present system-level trace analysis that highlight waiting between tasks.
Callgrind is a profiler that helps to find hotspot in the application. One limitation of a profiler is that the time spent waiting is not taken into account, for instance I/O, resources or other tasks. This situation is shown in figure 1, where we traced the command "sudo apt-get install tree --yes". The actual computation done in the apt-get process accounts for 63% of the elapsed time, while waiting time is about 37%. The callgrind results covers only instructions from the application, not the waiting time.
How to effectively understand what the application was waiting for? For this matter, we performed a waiting dependency analysis on all tasks on the system. The event sched_wakeup indicates the waiting source. Figure 2 shows the result of waiting dependencies among tasks for the command.
The analysis resolves waiting time recursively. In this run, apt-get process is waiting for dpkg, and it accounts for about 20% of the execution time. Figure 3 shows the wait I/O that occurs in dpkg, up to the kernel thread responsible for the file system journal of the partition on which the I/O is performed.
Another interesting part of the execution is the update of man database performed by mandb. Figure 4 shows that about 200 threads are spawned. In this case, the overhead of starting the threads and setup communication pipe is high compared to the amount of actual work, in consequence running time could be greatly improved by using a thread pool instead.
We located the code responsible for creating all these threads and processes using perf callchain. It seems to be related to how the library libpipeline is working. Here is an example of an interesting call stack:
Callgrind is a profiler that helps to find hotspot in the application. One limitation of a profiler is that the time spent waiting is not taken into account, for instance I/O, resources or other tasks. This situation is shown in figure 1, where we traced the command "sudo apt-get install tree --yes". The actual computation done in the apt-get process accounts for 63% of the elapsed time, while waiting time is about 37%. The callgrind results covers only instructions from the application, not the waiting time.
![]() |
| Figure 1: State of apt-get process according to time. |
How to effectively understand what the application was waiting for? For this matter, we performed a waiting dependency analysis on all tasks on the system. The event sched_wakeup indicates the waiting source. Figure 2 shows the result of waiting dependencies among tasks for the command.
![]() | |
|
![]() |
| Figure 3: I/O wait of dpkg according to time. |
![]() |
| Figure 4: Execution of mandb according to time. |
7ffff729a30b __execvpe (/lib/x86_64-linux-gnu/libc-2.17.so)
7ffff75a4de4 pipecmd_exec (/usr/lib/x86_64-linux-gnu/libpipeline.so.1.2.2)
409813 [unknown] (/usr/local/bin/mandb)
7ffff75a4e59 pipecmd_exec (/usr/lib/x86_64-linux-gnu/libpipeline.so.1.2.2)
7ffff75a662a pipeline_start (/usr/lib/x86_64-linux-gnu/libpipeline.so.1.2.2)
408d96 find_name (/usr/local/bin/mandb)
40449c test_manfile (/usr/local/bin/mandb)
404708 testmandirs (/usr/local/bin/mandb)
405035 update_db (/usr/local/bin/mandb)
40a1c6 mandb (/usr/local/bin/mandb)
40a4fb process_manpath (/usr/local/bin/mandb)
403777 main (/usr/local/bin/mandb)
7ffff71f9ea5 __libc_start_main (/lib/x86_64-linux-gnu/libc-2.17.so)
403b09 _start (/usr/local/bin/mandb)
At the end of apt-get execution, there is a sleep of 500 ms, shown in blue in the figure 2. Here is the location in the code of this nanosleep, again using perf callchain feature:
ffffffff816cc0c0 __schedule ([kernel.kallsyms])
ffffffff816cc799 schedule ([kernel.kallsyms])
ffffffff816cb66c do_nanosleep ([kernel.kallsyms])
ffffffff810827f9 hrtimer_nanosleep ([kernel.kallsyms])
ffffffff8108292e sys_nanosleep ([kernel.kallsyms])
ffffffff816d616f tracesys ([kernel.kallsyms])
7ffff72978c0 __GI___libc_nanosleep (/lib/x86_64-linux-gnu/libc-2.17.so)
7ffff7b8ac95 pkgDPkgPM::DoTerminalPty(int) (/usr/lib/x86_64-linux-gnu/libapt-pkg.so.4.12.0)
7ffff7b93720 pkgDPkgPM::Go(int) (/usr/lib/x86_64-linux-gnu/libapt-pkg.so.4.12.0)
7ffff7b26585 pkgPackageManager::DoInstallPostFork(int) (/usr/lib/x86_64-linux-gnu/libapt-pkg.so.4.12.0)
415a1b [unknown] (/usr/bin/apt-get)
418dfc [unknown] (/usr/bin/apt-get)
7ffff7af96c2 CommandLine::DispatchArg(CommandLine::Dispatch*, bool) (/usr/lib/x86_64-linux-gnu/libapt-pkg.so.4.12.0)
40a2ec [unknown] (/usr/bin/apt-get)
Here is the detail of pkgDPkgPM::DoTerminalPty() function from apt/apt-pkg/deb/dpkgpm.cc:
/*
* read the terminal pty and write log
*/
void pkgDPkgPM::DoTerminalPty(int master)
{
unsigned char term_buf[1024] = {0,0, };
ssize_t len=read(master, term_buf, sizeof(term_buf));
if(len == -1 && errno == EIO)
{
// this happens when the child is about to exit, we
// give it time to actually exit, otherwise we run
// into a race so we sleep for half a second.
struct timespec sleepfor = { 0, 500000000 };
nanosleep(&sleepfor, NULL);
return;
}
if(len <= 0)
return;
FileFd::Write(1, term_buf, len);
if(d->term_out)
fwrite(term_buf, len, sizeof(char), d->term_out);
}
The comment mentions a possible race, but the caller may be fixed to account for this situation. IMHO, this function should not sleep if an error occurs while reading the file descriptor, and should instead return immediately.
This was a small example of what can be achieved with the waiting dependency analysis from a kernel trace. The analysis plug-in will be available soon in Eclipse Linux Tools, and uses standard tracepoints from the Linux kernel, recorded with LTTng. I hope that this information will help the community to improve performance of installing packages with APT.
Cheers!
vendredi 7 juin 2013
How slow is Java reflection?
I use Java reflection for trace analysis, as a way to call hooks when specific events are encountered. I wanted to know the overheard related to using such dynamic invocation. First, here is a small example of a trace event handler.
By convention, the function "handle_sched_switch" is called only with an instance of "sched_switch" event as argument. The magic happens by first getting a reference the method by it's name (done once), and then call it dynamically later in the processing path, similar to the following small example.
To compare dynamic invocation to compile-time method call, I did a trivial benchmark program. Here are the results for 10 billion calls.
This experiment shows that dynamic invocation is roughly 5x slower than compile-time method call. Dynamic invocations is also weaker, because a missing method for the corresponding hook will be detected only at runtime.
There are benefits to using hooks. The test for the event type is done only once for all handlers. It avoid quite a lot of repetition. Also, it allows to list events required for a specific analysis, and then enable only this subset in the tracing session, reducing the runtime overhead and the trace size compared to enabling all events. So, we need to preserve these properties, but with compile-time invocations.
public class FooTraceEventHandler extends TraceEventHandlerBase {
public FooTraceEventHandler() {
super();
this.hooks.add(new TraceHook("sched_switch"));
}
public void handle_sched_switch(TraceReader reader,
CtfTmfEvent event) {
// Process event
}
}
By convention, the function "handle_sched_switch" is called only with an instance of "sched_switch" event as argument. The magic happens by first getting a reference the method by it's name (done once), and then call it dynamically later in the processing path, similar to the following small example.
method = dummy.getClass().getMethod("foo", (Class[]) null);
...
method.invoke(dummy);
To compare dynamic invocation to compile-time method call, I did a trivial benchmark program. Here are the results for 10 billion calls.
StaticMethodBenchmark 9,653000 DynamicMethodBenchmark 47,625000
This experiment shows that dynamic invocation is roughly 5x slower than compile-time method call. Dynamic invocations is also weaker, because a missing method for the corresponding hook will be detected only at runtime.
There are benefits to using hooks. The test for the event type is done only once for all handlers. It avoid quite a lot of repetition. Also, it allows to list events required for a specific analysis, and then enable only this subset in the tracing session, reducing the runtime overhead and the trace size compared to enabling all events. So, we need to preserve these properties, but with compile-time invocations.
Inscription à :
Articles (Atom)