- What is the cause of lattency in the system?
- How much resource a task require?
- What is the relationship between process?
- What is the critical path of a task?
- Which subsystem is the bottleneck of the system?
To answer such questions, a kernel trace is an excellent source of system performance data. It has low overhead and provide precise timings information about events occuring on the system. But, get an overview of a system behavior by looking at each individual events is a challenge. We need an analysis toolbox. In the rest of this blog, Four tools are presented with which you can experiement yourself. A summary example is presented to show the integration of various analysis made with flightbox, the prototype implementation.
Resource usage recovery
The basic metric needed to perform various other analysis is resource usage. CPU usage recovery has already been presented from previous post. The same kind of analysis can be done with memory, disk and network usage.In the case of CPU usage, kernel scheduling events indicates the process that drives the CPU. The CPU usage of a process is thus the sum of scheduled time. To display on a chart, CPU usage intervals are decomposed in fixed time range. An average usage is then easy to compute, and the precision can be increased by reducing the duration of time interval. The technique is presented on the following figure.
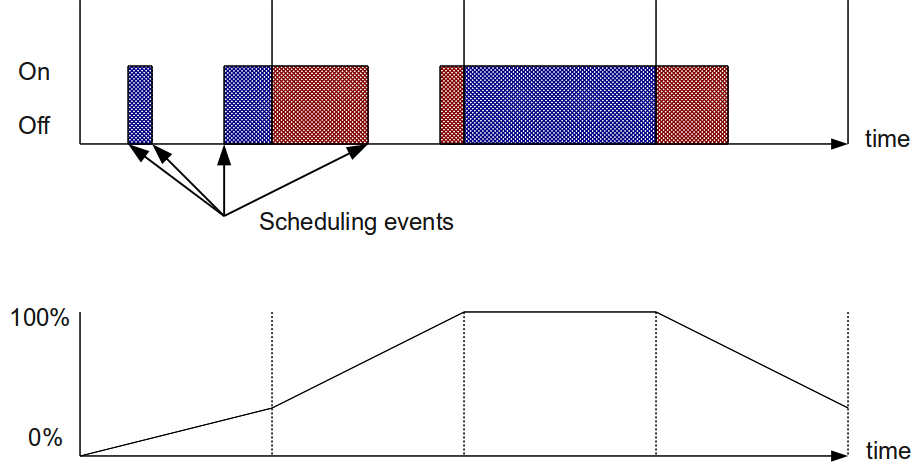
This technique is known as geometric integration. This computation behaves somewhat like a low-pass filter, by smoothing the raw CPU usage, making it easier to understand. The size of the resulting data is proportional to the trace duration times the desired precision times the number of process, no matter the trace size. In consequence, the CPU usage of a large trace can be summarized with a small array of doubles.
Blocking analysis
A process is blocked when a resource is not available and it can't progress. For example, we a process perform a read on a socket while the data is not yet received, the process block and the sceduler remove the waiting task from the running queue. Blocking can only occur in kernel mode. The main cause of blocking is in system calls. It can also occur during a page fault for which the page is swapped for example. The following picture shows typical example of blocking. Colors are matching legend in LTTV, green is for running in user mode, blue is for running in system call and red is for blocked on IO. Finally, orange represent the interval while the data is ready, but the process is not yet scheduled.
Some blocking are not necesserely bad. Waiting for user input or a server that waits for a request to come is not important. We are mostly interested on blocking on the critical path of an application, meaning blocking that induce processing delay from the user's point of view.
While a task is blocked, a subtask can perform some work. This subtask can also block, thus blocking among tasks is hierarchical.
Inter-process relationship
Under Linux, process can cooperate with various Inter-Process Communication mechanism, namely:
- Socket
- Pipe
- Fifo
- Mutex
- Signal
- Shared memory
- File lock
Those mechanism make possible to share resource, send message and data between process. Sockets are well instrumented in the Linux kernel. Hence, it's possible to recover the link between process that use socket to communicate. It works at the host level, but provided traces from many hosts, it would be possible to recover links between distributed components. For example, we could recover process relationship for an httpd client, shown at the following figure.

Resource usage accounting
The idea behing resource usage accounting is to associate resource usage of a server to the client that does the request. This analysis is able to compute the cost of some request accros distributed process as if it was performed by only one thread. To perform this analysis, ressource usage, inter-process relationship and blocking analysis are required.
For example, say that an http client perform a request on a web server. The resulting web page is returned to the client. While waiting for the web page, the http client blocks. By associating the CPU usage of the httpd thread that process the request of the client while it's blocked, the resource usage is effectively accounted to the right process. This is shown by the following figure.

Example
In the following example, we will use a special RPC client and server, srvhog and clihog from workload-kit. The binary srvhog has two commands, sleep and hog. Each operation takes 100ms. Sleep command is implemented with a timer and doesn't consume CPU, while hog command perform computation that last for the duration. A calibration procedure is performed when srvhog starts to ensure that the hog computation duration is close to 100ms. Communication between client and server is done by a simple TCP socket.
The following picture shows the CPU usage of the traced system, a host that has two cores, for the hog scenario. The overall CPU usage is shown in blue, while the CPU usage of srvhog is red. The calibration phase of srvhog last for about one second followed by a burst of about 100ms.

The second analysis shows blocking of clihog. It waits on system call read for 101ms, that correspond to the computation time of the server before reply is sent. Other blocking are very small and negligeable.

By analyzing socket operations of srvhog and clihog, the following graph can be computed. It shows that the client perform a connection to the server.

Finally, by computing resource accounting, the following report is obtained, showing that the CPU usage of srvhog while processing the request should be really accounted to clihog. CPU usage is almost 90ms, which is close to the expected 100ms and waiting time. The exact CPU usage is closer to 100ms and the error can be explained by the lost of precision while computing average CPU usage. To increase precision, smaller CPU usage intervals can be used.
Report for task pid=2668 cmd=/usr/local/bin/clihog

File descriptor blocking summary
FD                                       N    Sum (ms)
------------------------------------------------------
132.207.224.50:9876                      2     101,225

CPU accounting
PID                              Self (ms)    Sub (ms)  Total (ms)
------------------------------------------------------------------
2668 clihog                          2,675      89,797      92,471
 \_ 2666 srvhog                     89,797       0,000      89,797
Conclusion
Kernel analysis goes well beyong kernel developpers. Kernel trace can be very useful to system administrators and application developpers provided simple analysis tools that abstract trace events and produce meaningfull results to users.
Try it for yourself, see flightbox and workload-kit on github.
More to come, stay tuned!