Distributed Active Path from Kernel Trace
I presented recent work about the recovery of active path of a distributed program, only using a kernel trace. The result is a time-view of the execution across computers. One of the most interesting result is the Django Poll three-tiers app, including an Apache web server and a PostgreSQL database. Client is simulated by scripting with Mechanize. The screen shot shows the execution for the POST, where a large sync is visible near the end of the sequence, necessary for the update SQL statement.

Declarative views from user-space trace with Trace Compas
Geneviève Bastien presented how to use LTTng-UST and Trace Compas to create a time view of the state of an MPI computation. The MPI program simulates unbalanced computation, where the green represent work, and red is wait at the barrier. Multiple cycles are shown, and all the views are synchronized, which is handy to analyse the application at multiple level at once. In the following figure, we see below that the wait at the barrier (in red) is actually implemented using a busy loop calling non-blocking poll() system call, shown on top. We observed this behavior with the OpenMPI library, and we think it is intended to reduce the latency at the expense of power and resource efficiency. |
| Below: MPI imbalance application state (green: compute, red: wait). Above: corresponding kernel trace, including a zoom on the busy wait. |
Preemption analysis across host and virtual machines
Execution in virtual machines is subject to higher level of variation in response time. Geneviève Bastien presented the virtual machine analysis, that shows the preemption crossing virtual machines boundaries, the research result of former student Mohamad Gebai. A process in the VM may appear to run while it is not, because the process representing its virtual CPU on the host is be preempted. The host and the VMs are traced at the same time, and traces are synchronized. The global view of the resources allows to pinpoint preemption cause given a task, whenever the other task is local, on the host or inside another virtual machine. The following figure shows qemu processes on the host and traces from within the host. We clearly see a gettimeofday() that is much longer that one would expect (13ms instead of ~200ns), and the reason is that there is another process, in another VM, that was running for that time, and the preemption cause is shown below.
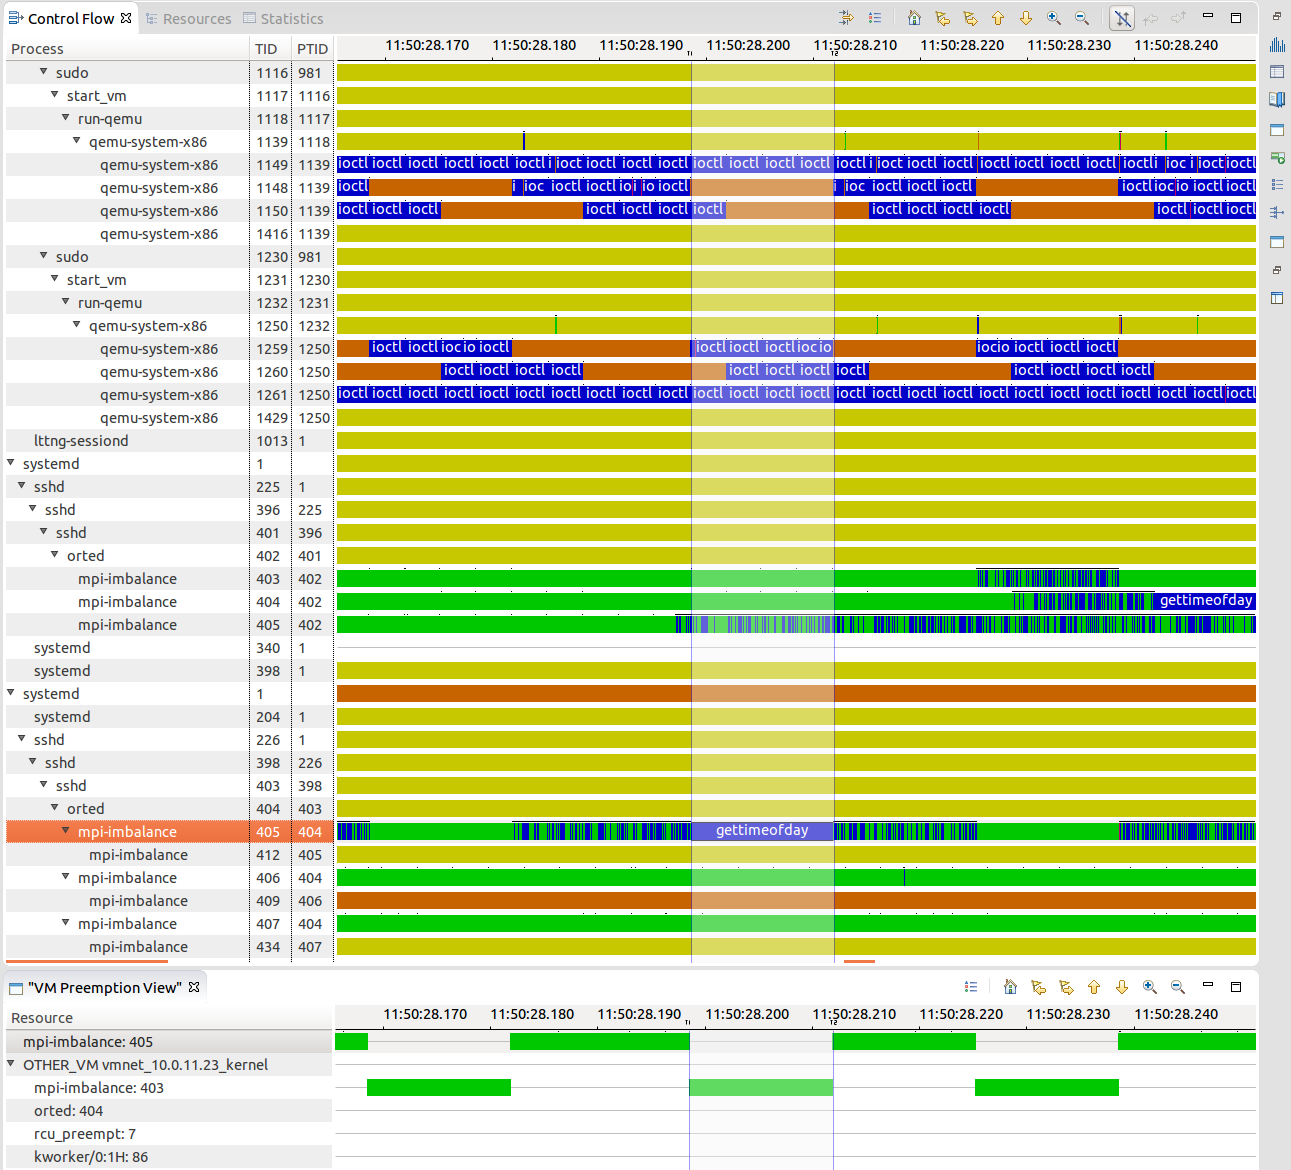 |
| Total view of the system, crossing virtual machine boundaries. |
ftrace
Sten Rosted from RedHat presented the inner working of ftrace. It is a framework to hook into each function in the kernel. The kernel is compiled with gcc -pg option, that adds a call to mcount() at the beginning of each function, but this call is replaced by nops. The space left in each function header is patched at runtime to jump to the instrumentation. This framework is used by kprobe, but the ftrace backend can be used directly instead.
folly
Ben Maurer from Facebook presented efficiency and scalability issues they face in their environment. Performance in accepting connections is critical. He mentioned that getting the next available file descriptor is a linear search that hurts the performance. He also shows a method to decrease the number of scheduling switch of workers by replacing pthread condition wait, and improving load distribution among threads. I liked his quantitative approach, always evaluating both kernel and user-space solutions to the same problem.
Cycle accurate profiling using CoreSight hardware trace
Pawel Moll from ARM presented the CoreSight instruction tracing capabilities. The processor records branch taken and the number of cycles taken by each instructions. He demonstrated a prototype of cycle accurate (i.e. exact cycle count) profiler. The trace decoding is somewhat cumbersome, because the code memory must be reconstructed offline to resolve address symbols, and the complete toolchain requires proper integration, but still an impressive demonstration.
Thanks to NVIDIA!
I also got a JETSON TK1 big.LITTLE board from NVIDIA. I will be able to test heterogenous traces experiments (x86, arm), a very common case for mobile and cloud computing. I will also be able to test the CoreSight tracing. Thanks NVIDIA!

