My Java program was using a lot of memory. An object was holding a reference on a large temporary data structure, even after it was out of scope. It is indeed difficult to understand what prevent the garbage collection to do its job. Here is how I found out.
- Download and extract Eclipse Memory Analyzer (MAT).
- Download the HeapDump.java class and insert a call to HeapDump.dumpHeap() after the point your think the memory should be released.
- Run the instrumented program. The resulting file size may be rather large (seems to be the hole VM memory), so make sure you have enough free space.
- Open it in MAT. (Notice: I was experiencing a hang bug on Ubuntu 14.04, dismiss the initial report dialog and do not generate HTML reports, it seems to trigger the bug). Click on Dominator Tree.
- Once you found the offending object, right click on it and select Path to GC Roots > with all references. This will display the references that prevent the GC to free this object.
- Fix the code and you can start over to verify that the problem is indeed fixed ;-)
The following screenshots shows an example of the tool usage for my problem. The class TmfNetworkEventsMatching matches send to receive network events in a trace. Unmatched packets are kept temporarily in memory. However, the old unmatched packets were never freed. In the Dominator Tree, we see that TmfNetworkEventsMatching is 40 bytes (Shallow Heap), but holds around 1.2MB of objects (Retained Heap). The Path to GC Roots highlights that a reference of TmfNetworkEventMatching is kept inside TmfRequestExecutor. In this case, a missing call to dispose() was preventing the release of resources. Other resources are auto-closable, except for one of them, which needs manual call to dispose(). Thank you MAT!
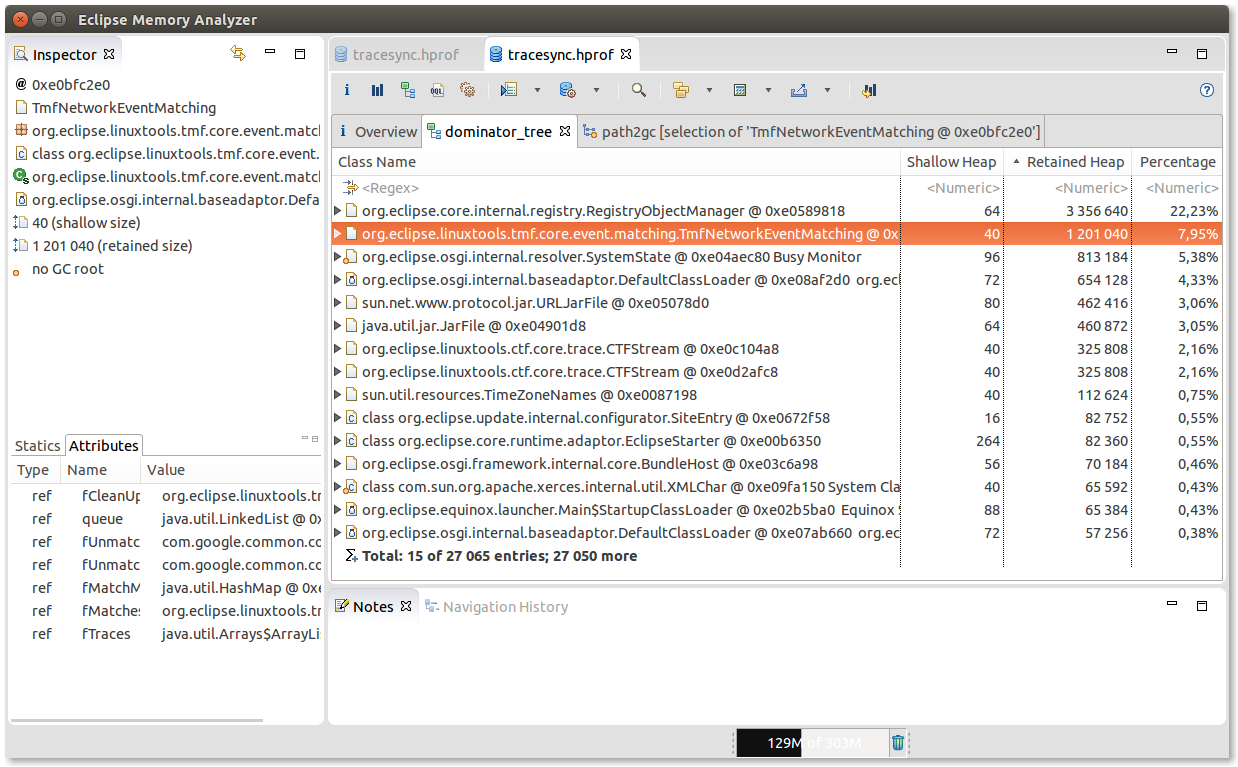 |
| Dominator Tree |
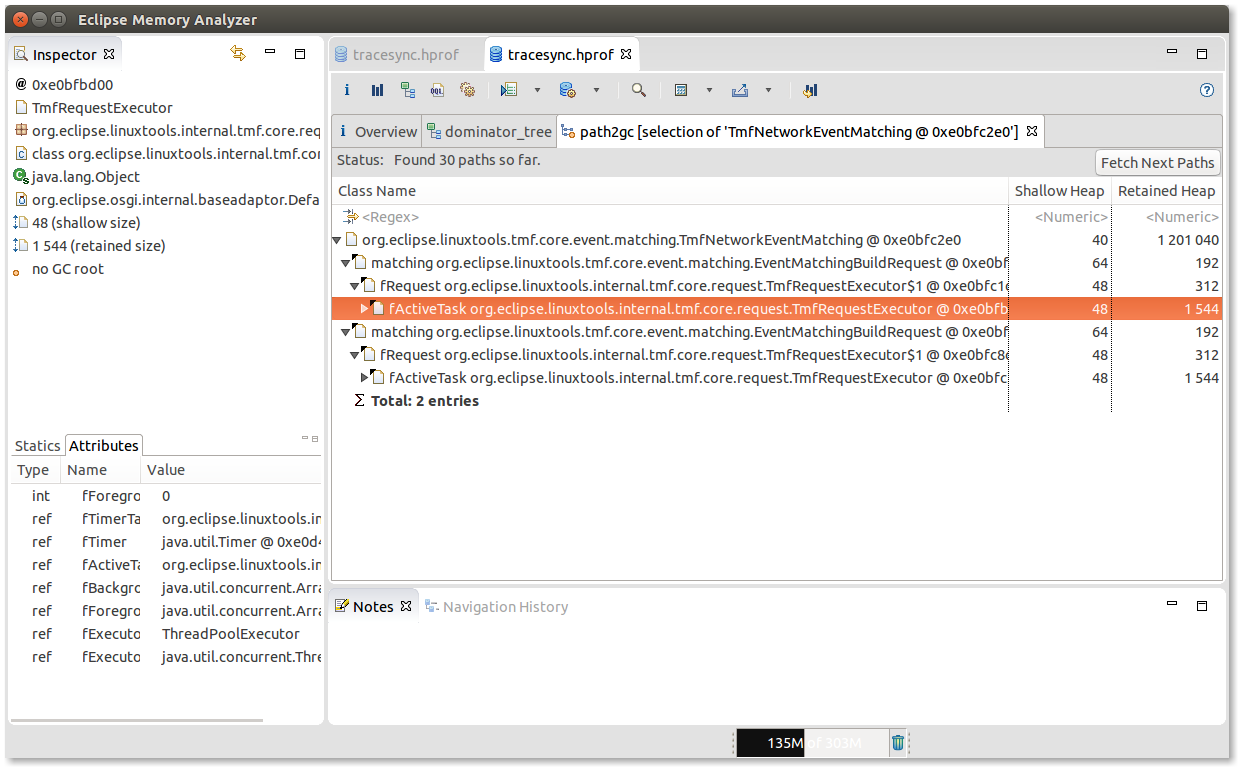 |
| Path to GC Roots |